Visitor Analytics for Retailers
With the increasing heterogeneity of retail customers, analysing loyalty cards and receipt data is no longer sufficient to understand customers. However, this understanding is important in order to stock the right product range and further optimise the shopping experience.
Analysing customers and visitors automatically
When measuring without technology, customers were previously counted manually and surveyed on a selective basis. However, this was very time-consuming and costly, which meant that customer analyses could only be carried out sporadically. Furthermore, the analysis was not available in real time, but had to be generated from the data over a period of weeks. Customer traffic can now be recorded using various technologies. Wi-Fi technology, Bluetooth Low Energy (BLE), Radio Frequency Identification (RFID), cameras and 3D sensors each offer advantages and disadvantages in different areas of application.
With cameras and 3D sensors, retailers can even track customers who do not carry a smartphone with them. In addition, the tracking is particularly accurate, so it works very well even in difficult lighting conditions or at high frequencies. The technology with cameras and 3D sensors is also compliant with data protection regulations. This is because no personal data is stored. It is not possible to draw conclusions about individual customers.

Visitor frequency analyses for data-driven decisions
A visitor frequency analysis helps to determine the number of visitors to a store, identify the age and gender of visitors, find out the busiest times, and identify the most important customer routes. Without detailed knowledge of customer traffic, retailers tend to act blindly when making management decisions. The following metrics are particularly important.
Highly accurate people counting
Retailers determine visitor frequency in their stores by counting people in the entrance area. Visitor frequency can also be measured separately for floors or defined areas, allowing for more in-depth analysis. Once processed and evaluated, the data provides an important basis for deriving further key figures and making business decisions. The visitor frequency key figure obtained must be interpreted as accurately as possible by those responsible.
Recognition of peak times and off-peak times
For effective staffing, retailers need to know when visitor frequency is typically above or below average. The evaluation of peak and off-peak times in terms of visitor numbers mainly concerns the different times of day. However, a differentiated analysis is also appropriate with regard to seasons, promotional days or around public holidays. A detailed customer traffic analysis provides the necessary results. This enables retailers to identify deviations in visitor flow at an early stage and adjust staffing levels to suit the situation.
Analysis of demographic characteristics by age and gender
Customer analysis can be used to determine more than just the number of people in front of the store or on the sales floor. It is also possible to learn more about the demographic structure of visitors and systematically evaluate their behaviour in the store. This includes, above all, age and gender.
Furthermore, it is possible to record the group size of customers who shop together. With this knowledge, the product range can be even better adapted to the demographic structure of the customer base. Differences in gender and age structure between locations can also explain differences in performance.
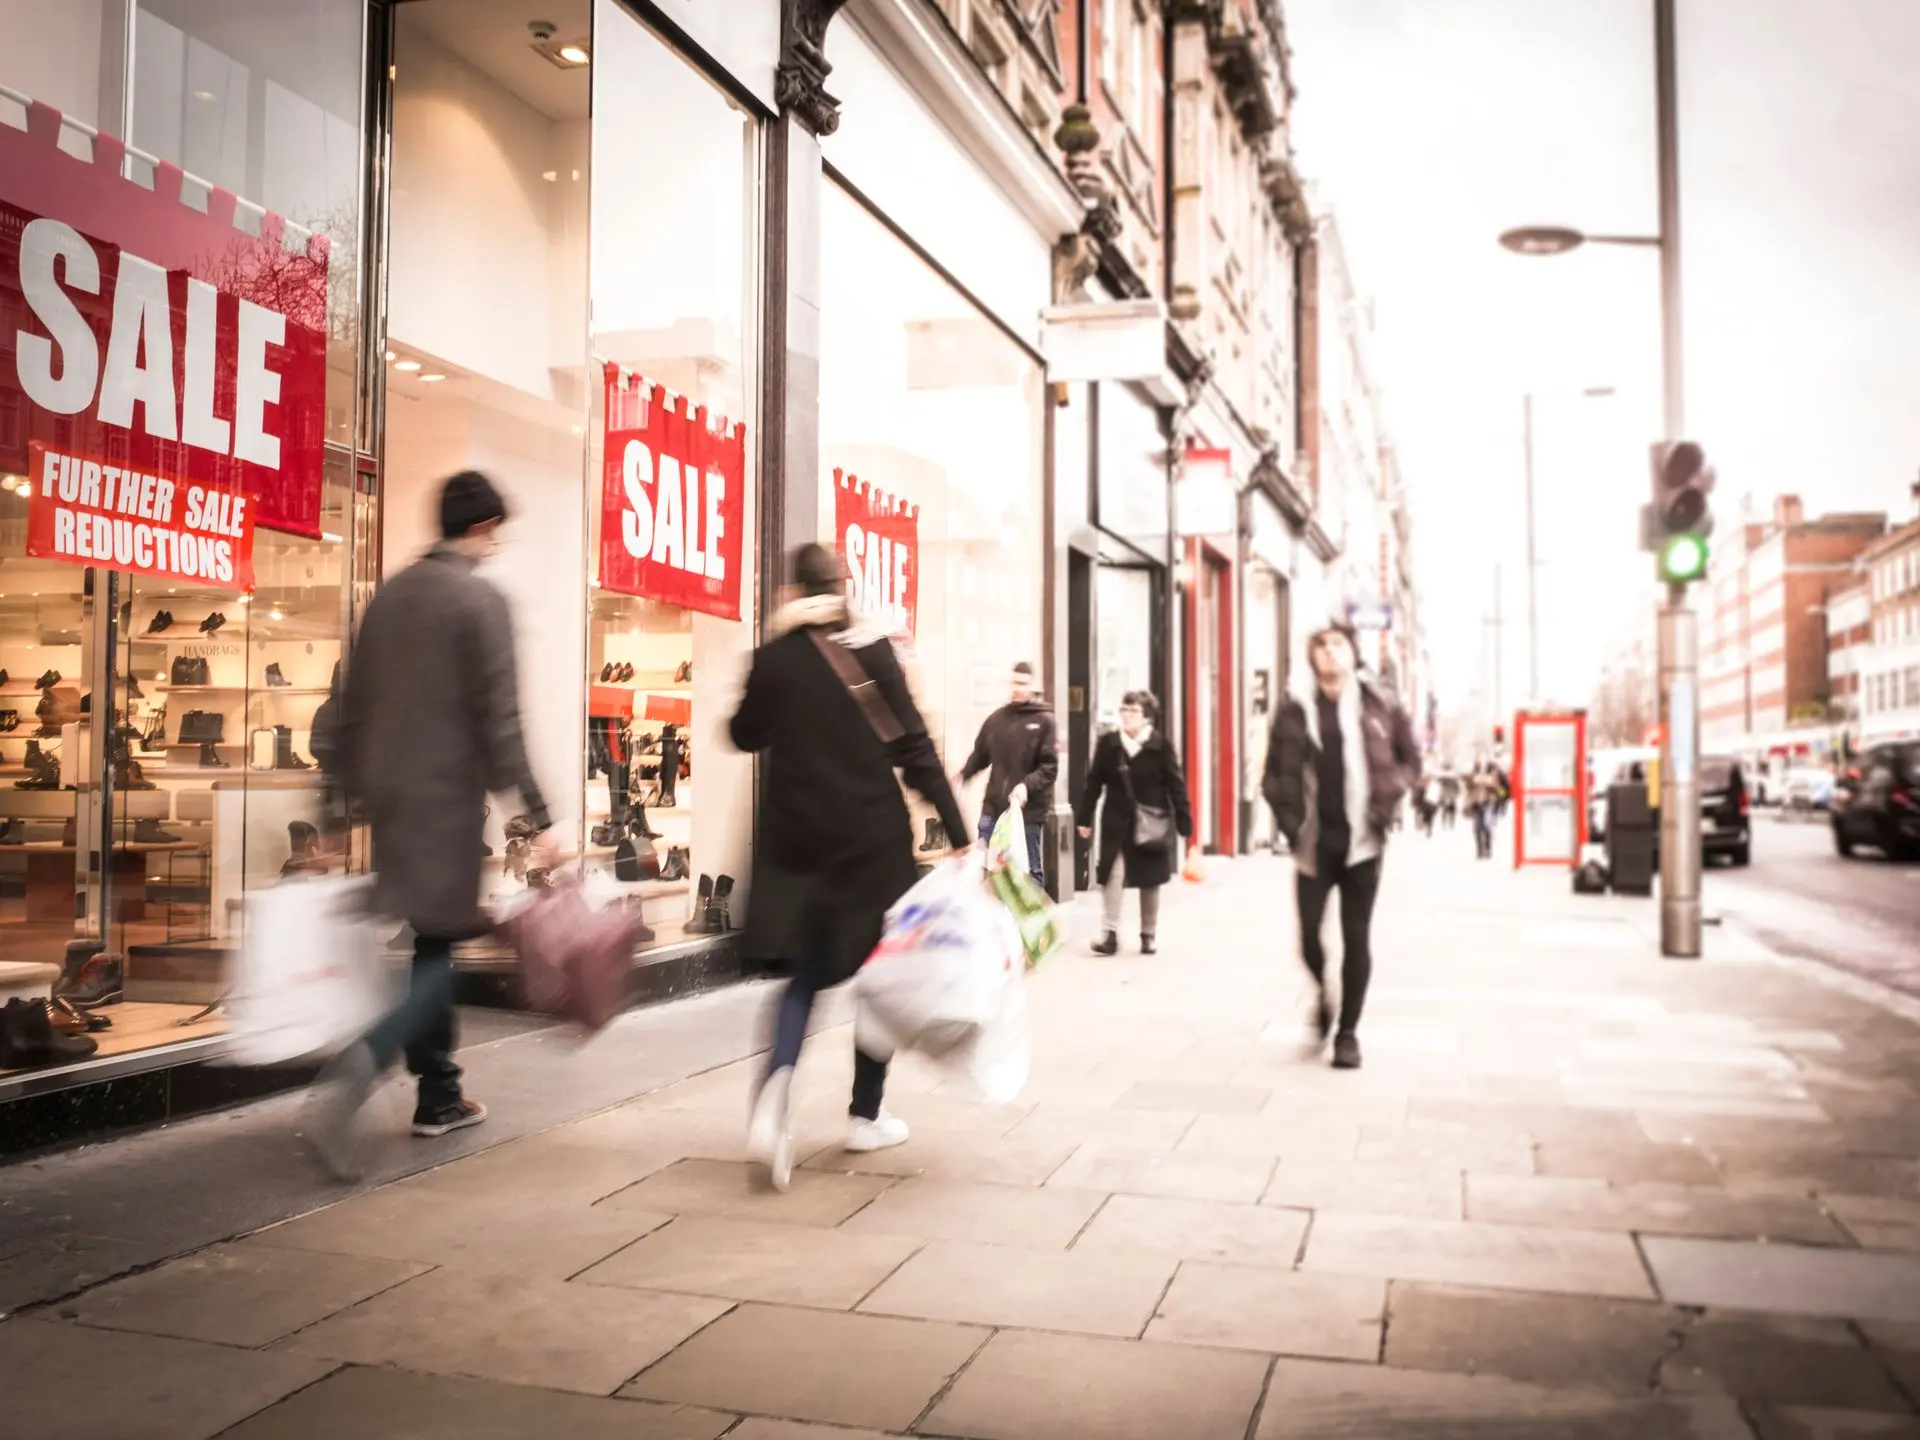
Determining the capture rate by counting passers-by
Every shop wants to attract as many passers-by as possible to its sales area. To measure this, a 3D sensor is mounted on the inside of the shop window, which not only measures the frequency of passers-by, but also the length of time viewers spend in front of the shop window.
Retailers can therefore use frequency measurement before and in the store to determine the capture rate, which represents the ratio between visitors and passers-by. Changes in the capture rate provide information about the attractiveness of the shop window and the entrance area. As part of a customer analysis, it can also provide information about the success of advertising measures.
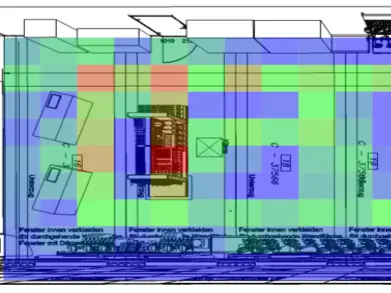
Analysis of walking routes through continuous tracking at the POS
As part of customer analysis, it is extremely important to continuously record typical walking routes in order to understand customer behaviour on the sales floor. Retailers can use this data to implement appropriate optimisation measures. If retailers know the main walking routes, they can position product groups in a targeted manner to increase sales.
It also makes sense to deploy more staff to provide advice in these areas. To encourage more customers to visit areas that have been less frequented in the past, retailers can use the analysis to adjust the layout, lighting and signage.
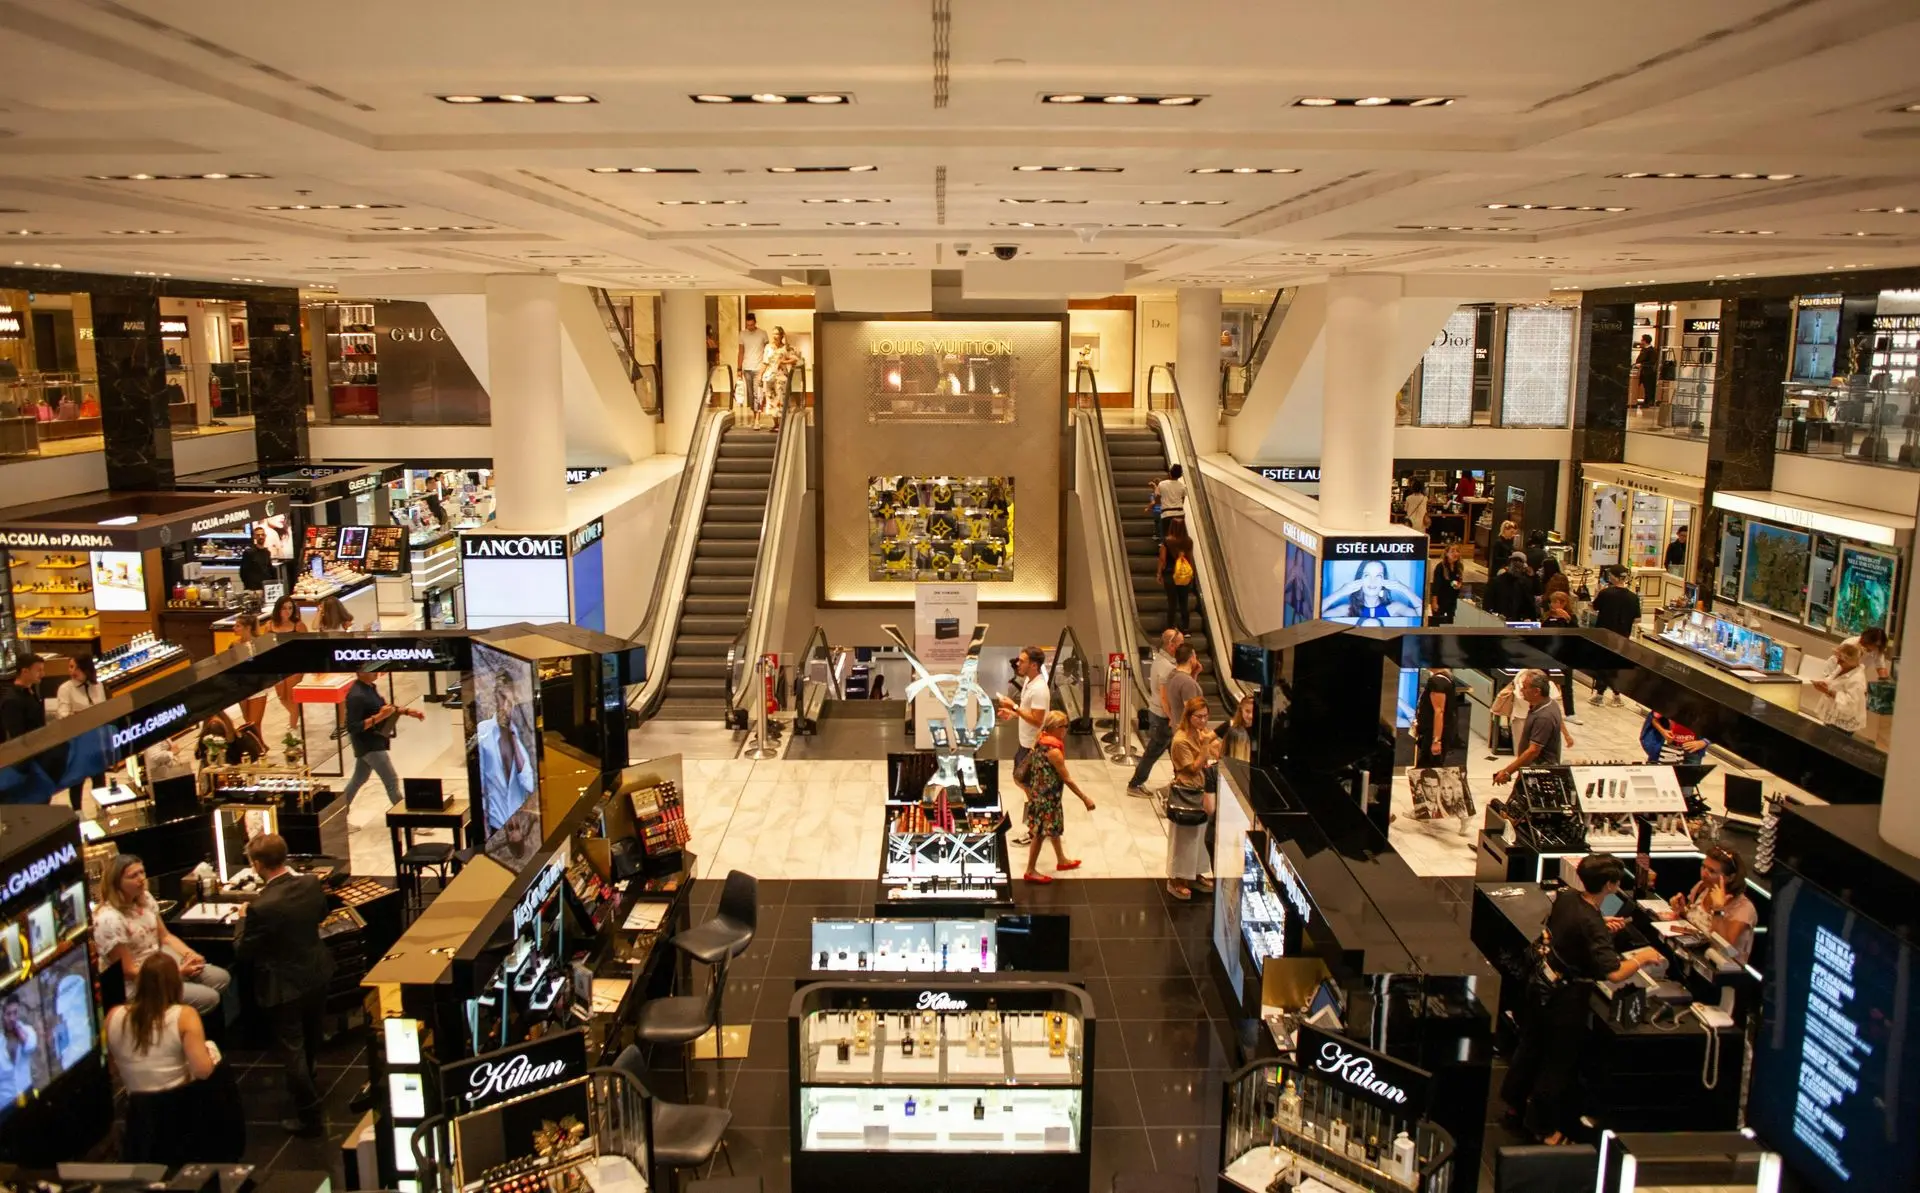
Measuring attractiveness at the POS by measuring dwell time
When analysing customers, it is also possible to measure the average time visitors spend in a store. This measurement can refer to the total area, but also to individual floors, departments and promotional areas.
Knowing the average dwell time gives retailers another important KPI for additional optimisation measures.
Implement digital visitor analytics
Analysing customer numbers, structure and behaviour has become increasingly popular in the retail sector. Large chain stores in particular are pioneers in customer traffic analysis, using it to make management decisions based on reliable data.
But smaller retailers are also successfully using retail analytics. The key figures obtained form the basis for data-driven management of a store and its sales areas. We support you in selecting the right technology and implementing digital customer analysis for your store.
More than 1,000 brands and companies
already trust in Crosscan.
Do you have any further questions about data-based visitor analysis for the retail sector?
Please feel free to contact us for further information – we look forward to hearing from you!